Expert consulting services for the Investment
management industry
Investment Performance Measurement Explained
What is Investment Performance?
Investment performance is the return on an investment portfolio. The investment portfolio can contain a single asset or multiple assets. The investment performance is measured over a specific period of time and in a specific currency. Investors often distinguish different types of return. Return on investment (ROI) is a performance measure used to evaluate the efficiency or profitability of an investment or compare the efficiency of a number of different investments. ROI tries to directly measure the amount of return on a particular investment, relative to the investment's cost.
Measuring investment performance is essential for investors to evaluate the effectiveness of their investment strategies, compare their investments against investment benchmarks or peers, and make informed decisions on investment portfolio adjustments.
The four measures of investment portfolio performance are:

How to Measure Investment Performance
While a simple total return calculation of taking the total value of an investment portfolio and dividing it by the capital contributed can tell you how much money you’ve made, it won’t take into account the rate or pace at which wealth has accumulated (or not), nor will it tell you if the growth achieved is acceptable for the time that has passed.
For purposes of measuring an investment portfolio’s performance, the two most common rate of return methodologies are dollar-weighted and time-weighted return metrics. These two approaches are fairly similar but each tell a separate story and are appropriate to use in different situations.
The simplest Rate of Return formula is:
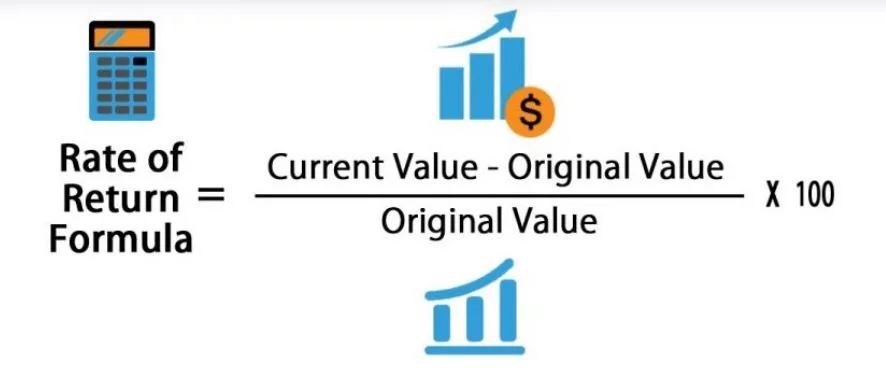
Performance attribution, or investment performance attribution is a set of techniques that performance analysts use to explain why a portfolio's performance differed from the benchmark. This difference between the portfolio return and the benchmark return is known as the active return. The active return is the component of a portfolio's performance that arises from the fact that the portfolio is actively managed.
Attribution analysis attempts to distinguish which of the various different factors affecting portfolio performance is the source of the portfolio's overall performance. Specifically, this method compares the total return of the manager's actual investment holdings with the return for a predetermined benchmark portfolio and decomposes the difference into a selection effect and an allocation effect.
Key Metrics for Investment Management Performance Measurement
Investors may use multiple benchmarks for monitoring portfolio performance or for measuring individual investment security performance. The primary portfolio monitoring metric for performance is total return, which is usually measured against a benchmark. This and other metrics including statistical risk methods include:
Portfolio Return vs. Benchmark
Standard deviation is a measure of volatility of an investment or a portfolio. For example, a higher standard deviation indicates a greater price variation, or higher volatility, from average performance. To reduce volatility in a portfolio, many investors employ diversification strategies by investing in a variety of assets.
Standard Deviation
Standard deviation is a measure of volatility of an investment or a portfolio. For example, a higher standard deviation indicates a greater price variation, or higher volatility, from average performance. To reduce volatility in a portfolio, many investors employ diversification strategies by investing in a variety of assets.
Beta
Standard deviation is a measure of volatility of an investment or- a portfolio. For example, a higher standard deviation indicates a greater price variation, or higher volatility, from average performance. To reduce volatility in a portfolio, many investors employ diversification strategies by investing in a variety of assets.
R-Squared
R-squared is a statistical measure that represents an investment's price movements that correlate with the movements of its benchmark index. Usually expressed as a percentage, R-squared may range from 0% to 100%. For example, an R-squared of 0.95 means that 95% of the investment's price movements are correlated to its benchmark.
For example, if an investor were using an S&P 500 index fund as a core holding in their portfolio, they may want to find an investment with a low R-squared compared to the S&P 500 to help diversify the portfolio.
Sharpe Ratio
R-squared is a statistical measure that represents an investment's price movements that correlate with the movements of its benchmark index. Usually expressed as a percentage, R-squared may range from 0% to 100%. For example, an R-squared of 0.95 means that 95% of the investment's price movements are correlated to its benchmark.
For example, if an investor were using an S&P 500 index fund as a core holding in their portfolio, they may want to find an investment with a low R-squared compared to the S&P 500 to help diversify the portfolio.
Sortino Ratio
R-squared is a statistical measure that represents an investment's price movements that correlate with the movements of its benchmark index. Usually expressed as a percentage, R-squared may range from 0% to 100%. For example, an R-squared of 0.95 means that 95% of the investment's price movements are correlated to its benchmark.
For example, if an investor were using an S&P 500 index fund as a core holding in their portfolio, they may want to find an investment with a low R-squared compared to the S&P 500 to help diversify the portfolio.
Treynor Measure
Jack Treynor introduced the concept of the security market line, which defines the relationship between portfolio returns and market rates of returns whereby the slope of the line measures the relative volatility between the portfolio and the market (as represented by beta). The beta coefficient is the volatility measure of a stock portfolio to the market itself. The greater the line's slope, the better the risk-return tradeoff.
Jensen Ratio
The Jensen ratio measures how much of the portfolio's rate of return is attributable to the manager's ability to deliver above-average returns, adjusted for market risk. The higher the ratio, the better the risk-adjusted returns. A portfolio with a consistently positive excess return will have a positive alpha while a portfolio with a consistently negative excess return will have a negative alpha.
Information Ratio
The Information Ratio measures the excess return of an investment relative to a benchmark, adjusted for the risk taken. A higher Information Ratio indicates a better risk-adjusted performance compared to the benchmark, making it useful for evaluating active investment strategies.
Investment Performance Monitoring Frequency
In addition to selecting the appropriate performance monitoring metrics, investors need to choose the monitoring frequency. Investment performance measurement helps investors to monitor the process towards set investment objectives with a view to either modify the objectives or modify the strategies to get to the objectives. For example, a common portfolio valuation for an investment or for a portfolio is quarterly (every three months). This frequency is often chosen, in part, because investment data is commonly reported during earnings season on a quarterly basis. While an investor may not make changes to their portfolio on a consistent basis, it's important to monitor the metrics periodically.
Helpful Hints in Evaluating Performance
Remember to keep these factors in mind when calculating any type of Performance return:
Transaction Fees
To be sure your calculation is accurate, it's important to include the transaction fees you pay when you buy your investments. If you're calculating return on actual gains or losses after selling the investment, you should also subtract the fees you paid when you sold.
Data Collection and Quality Assurance
Performance is calculated in the same way, in every system. Yet, it is typically the system inputs that determine the quality assurance of the information presented. Your returns are only as good as the data inputs, and the processes surrounding those inputs.
Bookkeeping
If your investments are spread out among different financial firms, it’s a good idea to create a master spreadsheet that contains each investment and its value at the time you undertake your evaluation.
Tax Implications
Computing after-tax returns is important, including capital gains and losses. This is often helpful to do with the help of a tax professional. Learn more about capital gains.
Inflation Considerations
With investments you hold for a long time, inflation may play a big role in calculating your return. Inflation means your money loses value over time.
Yearly Comparisons
This will help you see when different investments had strong returns and when the returns were weaker. Among other things, year-by-year returns can help you see how your various investments behaved in different market environments.
portfolio Rebalancing
Be prepared to make adjustments when the situation calls for it. This is referred to as portfolio rebalancing.
Types of Investment Benchmarks
An investment benchmark is a standard against which something is compared. Investors use benchmarks to measure the performance of securities, mutual funds, exchange-traded funds, portfolios, or other investment instruments.
Typically, benchmarks come in 3 categories:
Market Indices
These are broad market measures representing the performance of specific market segments or asset classes. They are widely used as benchmarks for passive and active investment strategies.
Peer Group Comparison
These comparisons involves comparing the performance of an investment against a group of similar investments or funds. This type of benchmarking helps investors evaluate the relative performance of their investments within a specific category or style.
Customized Benchmarks
These are tailored to an investor's unique goals, risk tolerance, and investment preferences. They provide a more personalized basis for performance evaluation and decision-making.
Factors Affecting Investment Performance
Investment decisions are also influenced by a multitude of factors, some of which, are listed below.
Economic Conditions
Economic conditions, such as growth rates, inflation, interest rates, and fiscal policies, can significantly influence investment performance. Investors should monitor these conditions and adjust their strategies accordingly to optimize returns.
Market Trends and Cycles
Market trends and cycles, such as bull and bear markets, can also affect investment performance. Understanding these trends and adapting investment strategies to different market environments can enhance performance over time.
Investment Strategy and Style
Investment strategy and style, such as value or growth investing, can impact performance due to differing risk and return profiles. Aligning an investment strategy with an investor's objectives and risk tolerance is critical for achieving desired performance.
Portfolio Management
Effective portfolio management involves selecting, monitoring, and adjusting investments to optimize performance and manage risk. Regular portfolio reviews and adjustments can help maintain a balanced and diversified investment mix, contributing to better performance.
Investor Behavior
Investor behavior, such as emotional decision-making or lack of discipline, can negatively impact investment performance. Developing a disciplined investment approach and avoiding common behavioral biases can help improve performance.
Past Performance Does Not Guarantee Future Results
If you’ve been in Performance Management for any length of time, you will have seen this disclaimer. Performance measurement is backward looking but the results derived from such measurement help to inform and shape investors’ forward-looking decisions. Get to know this phrase, because it will be on every piece of Marketing material you ever produce.